- Despite being a key beneficiary of technological advancement we fail to apply this to our metrics and KPI's.
- We seem to be permanently stuck on static figures and trending common metrics like availability and utilization.
- Our reported metrics rarely if ever contain anything diagnostic both at the strategic and tactical levels.
For this reason I have continually tried to push the boundaries on performance management in several areas. First, by making use of modern technologies a lot better. Sometimes this is only in more advanced use of Excel, sometimes it incorporates Business Intelligence tools such as Business Objects, QlickView, Tableau or legacy tools like Cognos and CorVu.
Second by representing and using metrics in a vastly different way. This is a pretty big theme, it crosses a range of areas from chart types, to Synergistic / Antagonistic measures, through to leading / Lagging indicators.
With the chart below you can view it in many ways, so have a play with it. However, the best result is to set the Vertical Axis to "Downtime (mins)", the Horizontal Axis to "Time", the Color to "Breakdown Costs" and Size to "Total Labor".
Then press the play button in the lower left hand corner. To see trails click on the moving indicator.
The result is a very interesting combination of three dimensions when plotted over time. In this case it was done on a selection of conveying assets and it works very well when you are comparing a range of asset types.
The result is fascinating and provides analysts or executives with an immediately recognizable trend that can be immediately acted upon. We see a range of methods here; the combination of various indicators to see if they are antagonistic or synergistic, the use of modern technology, and the presentation of information in such as way so as to provide diagnostic information.
From here the steps required to reach a solution and validate the findings are far less than a one metric trend or static KPI figure.
Play as much as you like with the chart above, however I have captured an image of the final result when set as I mentioned earlier.
You could reproduce this by three or four lines trended together, but they can get a little confusing and do not represent the problem in a dynamic way.
What we can see from the above image is that:
The result is fascinating and provides analysts or executives with an immediately recognizable trend that can be immediately acted upon. We see a range of methods here; the combination of various indicators to see if they are antagonistic or synergistic, the use of modern technology, and the presentation of information in such as way so as to provide diagnostic information.
From here the steps required to reach a solution and validate the findings are far less than a one metric trend or static KPI figure.
Play as much as you like with the chart above, however I have captured an image of the final result when set as I mentioned earlier.
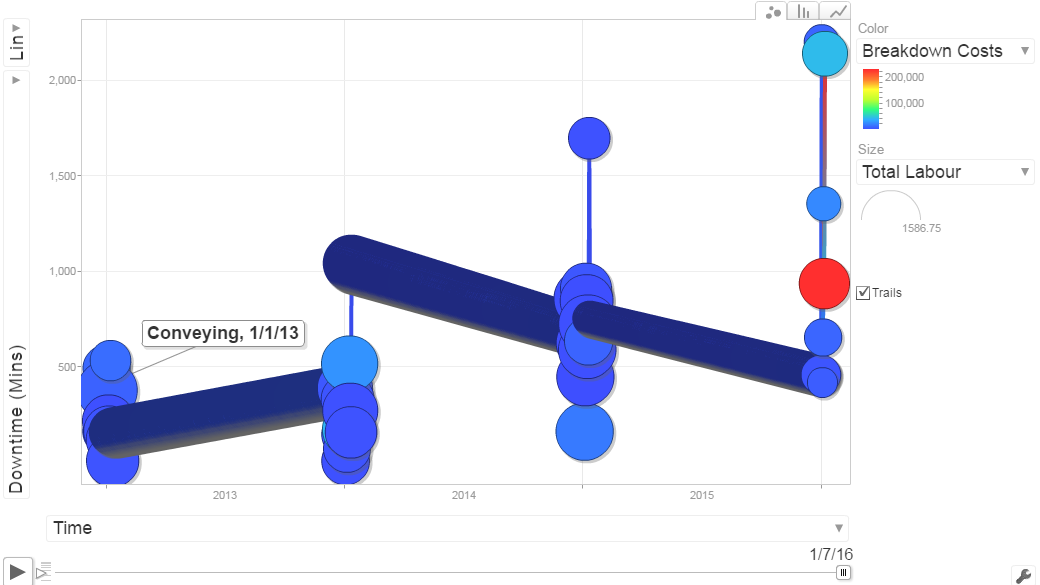 |
| Motion chart results |
What we can see from the above image is that:
- Downtime seems to follow a time based pattern, providing us with a good point to start from in further performance analysis
- As the labor dedicated to these assets falls (Size), for reasons as yet undetermined, the total breakdown time rises (Vertical), and (interestingly) the total breakdown costs (Color) also rise.
Like all performance tracking exercises this is not the answer in itself, but it is very definitely a far better starting point than static KPI's or standard, non-diagnostic trends.
I hope this is of use and interest to you, if so please share this post with your workmates and peers.
Good luck !
No comments:
Post a Comment